Table 2. Mass spectrometry analysis of sphingomyelin in the biopsies from pigs. For detailed information see Table 1. Given is the mean ± SD of each parameter, *p < 0.05, **p < 0.01, ***p < 0.001, ANOVA
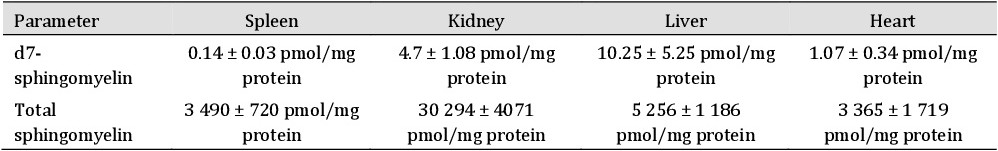
Table 2. Mass spectrometry analysis of sphingomyelin in the biopsies from pigs. For detailed information see Table 1. Given is the mean ± SD of each parameter, *p < 0.05, **p < 0.01, ***p < 0.001, ANOVA